Who Is John Bollinger And What Are His Bands?
Bollinger Bands are a technical analysis tool used by traders and investors to analyze and identify potential trends, price volatility, and overbought or oversold conditions in financial markets, such as stocks, currencies, commodities, and cryptocurrencies. They were developed by John Bollinger in the 1980s.
John Bollinger is a well-known American author, market analyst, and the creator of Bollinger Bands, a widely used technical analysis tool in the field of financial markets. Bollinger Bands are used to analyze the volatility and price movements of financial instruments. John Bollinger's work in technical analysis has had a significant impact on traders and investors.
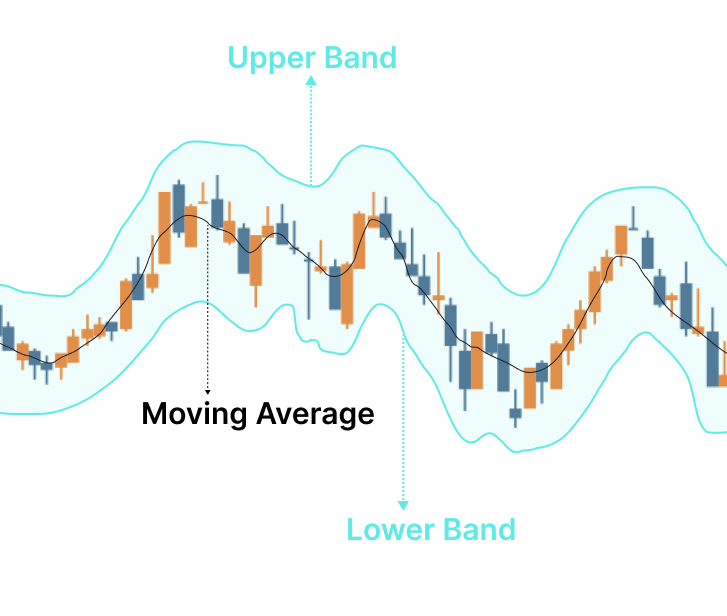
Bollinger Bands consist of three key components:
Middle Band: The middle band is a simple moving average (SMA) of the asset's price over a specific time. The most used period is 20 days (about 3 weeks), but traders can adjust it to their preferences.
Upper Band: The upper Bollinger Band is created by adding a specified number of standard deviations to the middle band. Typically, two standard deviations are used. This band represents potential resistance levels.
Lower Band: The lower Bollinger Band is created by subtracting the same number of standard deviations from the middle band. It serves as a support level.
Bollinger Bands are primarily used for the following purposes:
1. Volatility Measurement: Bollinger Bands expand and contract in response to market volatility. When the bands widen, it indicates increased volatility, and when they narrow, it suggests reduced volatility.
2. Trend Identification: Traders look for the price to stay within the bands during a strong trend. If the price consistently touches or exceeds the upper band, it may indicate an uptrend. Conversely, if it frequently touches or goes below the lower band, it may suggest a downtrend.
3. Overbought and Oversold Conditions: Bollinger Bands can help identify potential overbought or oversold conditions. When the price approaches or crosses the upper band, it may be overbought, suggesting a possible price reversal or correction. When the price nears or breaches the lower band, it may be oversold, indicating a potential bounce or reversal to the upside.
4. Trading Signals: Traders often use Bollinger Bands in conjunction with other technical indicators to generate buy or sell signals. For example, a common strategy is to buy when the price touches the lower band and sell when it touches the upper band.
It's essential to note that Bollinger Bands are not foolproof and should be used in conjunction with other technical and fundamental analysis tools. They are more effective when combined with other indicators and a trader's overall strategy. Additionally, the choice of the number of standard deviations and the period of the moving average can be adjusted to match the trader's specific preferences and the asset being analyzed.


