What is Reg T 

Regulation T, often referred to as "Reg T," is a set of rules established by the U.S. Federal Reserve Board under the Securities Exchange Act of 1934. It governs the extension of credit by broker-dealers to customers to purchase securities. The key provision of Reg T relates to the initial margin requirement, which is the amount of cash or eligible securities that must be deposited by an investor when purchasing securities on margin. 

Under Reg T, the initial margin requirement is generally set at 50% of the total value of the securities being purchased on margin. This means that investors are required to put up at least 50% of the purchase price in cash or eligible securities, and the broker can lend the remaining 50%. This regulation aims to establish a minimum level of equity that investors must contribute to their investments, providing a buffer against potential losses and ensuring a reasonable level of financial responsibility. 

Reg T also outlines maintenance margin requirements, specifying the minimum level of equity that must be maintained in a margin account. If the account falls below this level due to market fluctuations, the investor may be required to deposit additional funds or securities to bring the account back to compliance. 

Overall, Regulation T plays a crucial role in regulating the use of margin in securities transactions, promoting market stability, and protecting investors from excessive leverage. It sets standards for the amount of cash or eligible securities that investors must contribute to their investments, helping to mitigate risks associated with trading on margin. 
What is Portfolio Margin? 

Portfolio Margin is an advanced risk-based margining system utilized in the financial markets to determine the margin requirements for a diversified portfolio of financial instruments. Unlike traditional or "Reg T" margining, which employs fixed percentages for different asset classes, portfolio margining takes a holistic approach to assess the overall risk of an entire portfolio. This method aims to provide a more accurate representation of the potential financial exposure inherent in a combination of diverse positions. 

The portfolio margining system considers the net risk of the entire portfolio, accounting for the potential offsetting effects between different positions. It considers factors such as volatility, correlation, and potential market movements, offering a more nuanced and dynamic margin calculation. The goal is to recognize the risk-reducing benefits of a well-diversified portfolio, potentially leading to lower margin requirements compared to traditional margin methods. 

This approach is particularly advantageous for sophisticated investors, including hedge funds and high-net-worth individuals, who engage in complex trading strategies across multiple asset classes. By incorporating a more comprehensive risk assessment, portfolio margining allows these investors to optimize their capital efficiency while maintaining risk management standards. 

To utilize Portfolio Margin, traders typically need approval from their brokerage firms, which evaluate the investor's experience, financial standing, and understanding of the associated risks. The application of Portfolio Margin requires a deep understanding of the intricacies of financial markets and the potential impacts of various market scenarios on a diversified portfolio. 

In summary, Portfolio Margin is a sophisticated risk-based margining system that offers a more accurate representation of risk for diversified portfolios. By considering the overall risk profile and potential offsets within a portfolio, it aims to provide more efficient use of capital for experienced investors engaged in complex trading strategies across different asset classes. 

Who Is John Bollinger And What Are His Bands?

Bollinger Bands are a technical analysis tool used by traders and investors to analyze and identify potential trends, price volatility, and overbought or oversold conditions in financial markets, such as stocks, currencies, commodities, and cryptocurrencies. They were developed by John Bollinger in the 1980s.

John Bollinger is a well-known American author, market analyst, and the creator of Bollinger Bands, a widely used technical analysis tool in the field of financial markets. Bollinger Bands are used to analyze the volatility and price movements of financial instruments.  John Bollinger's work in technical analysis has had a significant impact on traders and investors. 

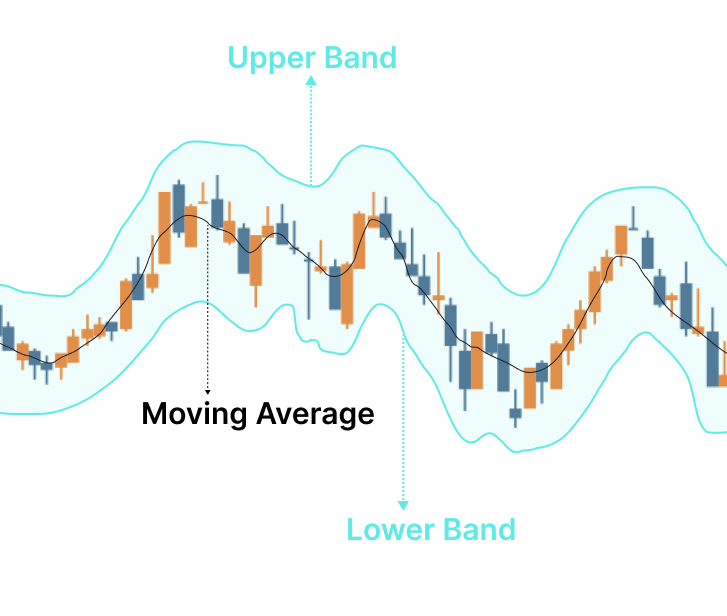
 Bollinger Bands consist of three key components:

Middle Band: The middle band is a simple moving average (SMA) of the asset's price over a specific time. The most used period is 20 days (about 3 weeks), but traders can adjust it to their preferences.

Upper Band: The upper Bollinger Band is created by adding a specified number of standard deviations to the middle band. Typically, two standard deviations are used. This band represents potential resistance levels.

Lower Band: The lower Bollinger Band is created by subtracting the same number of standard deviations from the middle band. It serves as a support level.

Bollinger Bands are primarily used for the following purposes:

1. Volatility Measurement: Bollinger Bands expand and contract in response to market volatility. When the bands widen, it indicates increased volatility, and when they narrow, it suggests reduced volatility.

2. Trend Identification: Traders look for the price to stay within the bands during a strong trend. If the price consistently touches or exceeds the upper band, it may indicate an uptrend. Conversely, if it frequently touches or goes below the lower band, it may suggest a downtrend.

3. Overbought and Oversold Conditions: Bollinger Bands can help identify potential overbought or oversold conditions. When the price approaches or crosses the upper band, it may be overbought, suggesting a possible price reversal or correction. When the price nears or breaches the lower band, it may be oversold, indicating a potential bounce or reversal to the upside.

4. Trading Signals: Traders often use Bollinger Bands in conjunction with other technical indicators to generate buy or sell signals. For example, a common strategy is to buy when the price touches the lower band and sell when it touches the upper band.

It's essential to note that Bollinger Bands are not foolproof and should be used in conjunction with other technical and fundamental analysis tools. They are more effective when combined with other indicators and a trader's overall strategy. Additionally, the choice of the number of standard deviations and the period of the moving average can be adjusted to match the trader's specific preferences and the asset being analyzed.

Italian Mathematician And Technical Analysis Go Together Like Spaghetti And Meatballs?

Fibonacci retracement is a technical analysis tool used in financial markets to identify potential levels of price correction or retracement within a trend. It's based on the Fibonacci sequence and specific ratios, primarily the key levels of 23.6%, 38.2%, 50%, 61.8%, and 76.4%.  These ratios were introduced to Western Europe by Fibonacci, also known as Leonardo of Pisa. He was an Italian mathematician from the Middle Ages who introduced the Hindu-Arabic numeral system to Europe and is famous for the Fibonacci sequence. 

To apply Fibonacci retracement, traders draw horizontal lines on a price chart from the peak to the trough of a trend, or vice versa, creating potential support and resistance levels. These levels are believed to correspond to natural price behaviors and have significance in many financial markets.

Fibonacci retracement is used for several purposes:

Identifying Support and Resistance: Traders use Fibonacci levels to anticipate where an asset's price might find support during a correction or encounter resistance in an uptrend. The 38.2% and 61.8% levels are especially significant.

Entry and Exit Points: Traders can use Fibonacci retracement levels to determine optimal entry points to buy or sell an asset within an existing trend.

Setting Stop-Loss and Take-Profit Orders: Fibonacci retracement helps in setting stop-loss orders to manage risk and take-profit levels to capture gains.

Confirmation: When other technical analysis tools, such as trendlines or moving averages, align with Fibonacci retracement levels, it can provide additional confirmation for trading decisions.

It's important to note that while Fibonacci retracement is widely used, it's not foolproof, and traders should consider it alongside other technical and fundamental analysis tools to make informed trading decisions.

Shampoo Or Chart Pattern Head And Shoulders?

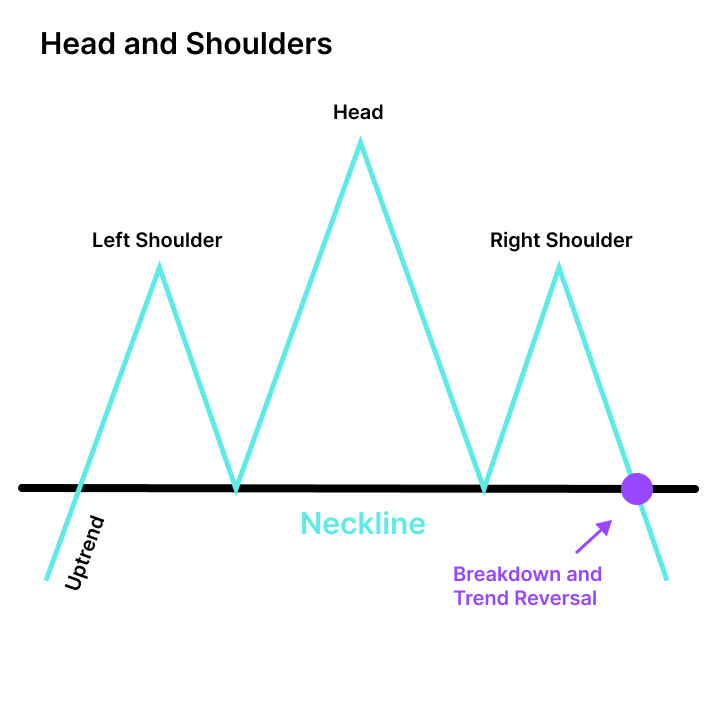
The Head and Shoulders pattern is a significant technical chart pattern in financial markets, primarily used to predict trend reversals. It is characterized by three distinctive peaks and troughs that resemble a human head and shoulders, typically seen after a prolonged uptrend and signaling a potential shift to a downtrend. The pattern consists of the following components:

Left Shoulder: The first peak forms during an uptrend, indicating a high point in the price.

Head: The central peak is the highest in the pattern and forms after the left shoulder, often reflecting a climax or strong resistance level.

Right Shoulder: The third peak, similar in height to the left shoulder, occurs after the head and typically signals weakening upward momentum.

Traders may use the Head and Shoulders pattern as follows:

Reversal Signal: When the pattern is complete, with the neckline connecting the lows of the left and right shoulders, a break below the neckline is considered a bearish reversal signal, suggesting that the price is likely to decline.

Entry and Stop-Loss: Traders typically enter short positions (sell) after the neckline break and set stop-loss orders just above the pattern's right shoulder.

Price Target: The projected price target for the Head and Shoulders pattern is estimated by measuring the vertical distance from the head to the neckline and subtracting it from the neckline's breakout point.

It's essential to use the Head and Shoulders pattern in conjunction with other technical and fundamental analysis tools to confirm potential trend reversals and make well-informed trading decisions.

Trading Different Shapes?

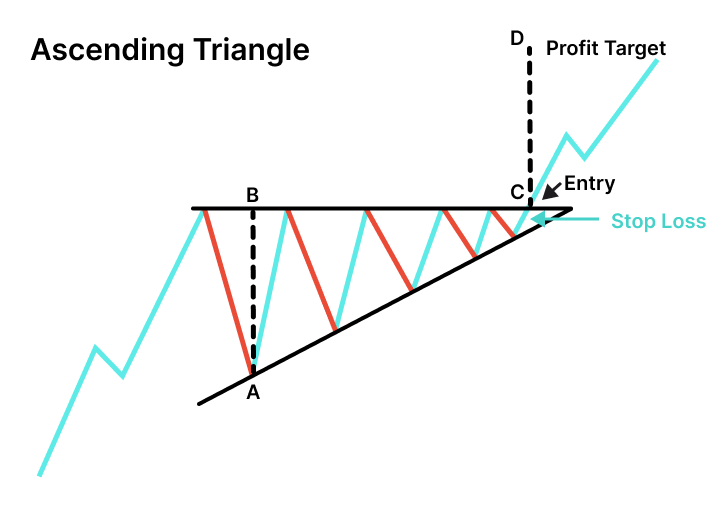
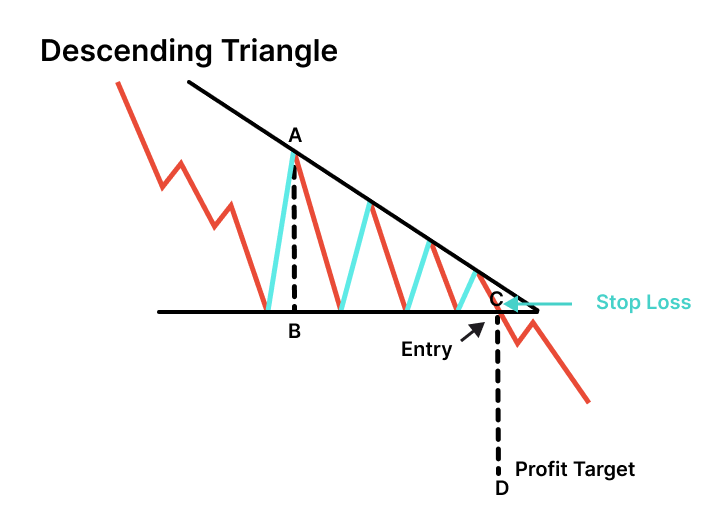
Ascending and Descending Triangles are common chart patterns used in technical analysis to predict potential price movements in financial markets.

1. Ascending Triangle:

An ascending triangle is a bullish continuation pattern formed during an uptrend.

It consists of a horizontal resistance line (upper trendline) and an ascending support line (lower trendline).

Traders look for the price to repeatedly touch the resistance level while the support line slopes upward.

The breakout typically occurs to the upside, indicating a potential upward continuation of the existing trend.

Traders can enter long (buy) positions when the price breaks above the resistance line, setting stop-loss orders below the support line.

The height of the triangle can be used to estimate a price target for the upward move.

2. Descending Triangle:

A descending triangle is a bearish continuation pattern formed during a downtrend.

It is characterized by a horizontal support line (lower trendline) and a descending resistance line (upper trendline).

Traders observe the price repeatedly touching the support level while the resistance line slopes downward.

The breakdown typically occurs to the downside, suggesting a potential continuation of the existing downtrend.

Traders can enter short (sell) positions when the price breaks below the support line, with stop-loss orders above the resistance line.

The triangle's height can be used to estimate a price target for the downward move.

Both patterns can be useful for identifying potential entry and exit points and for setting stop-loss and take-profit levels. However, as with any technical pattern, it's important to consider other factors and use additional analysis to make well-informed trading decisions.