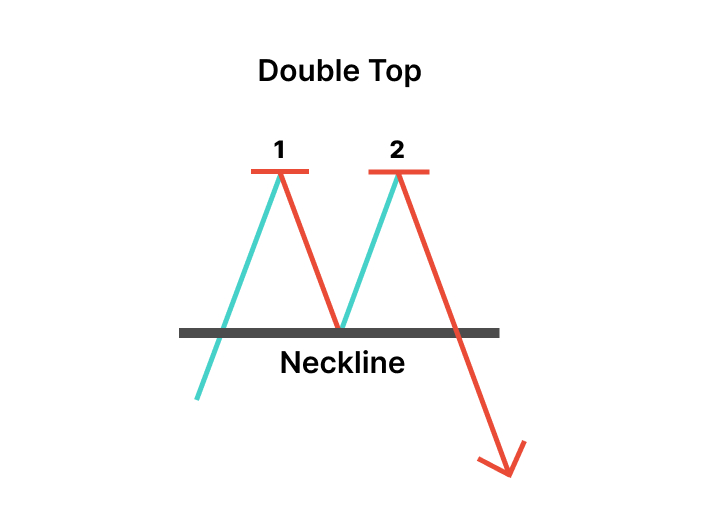
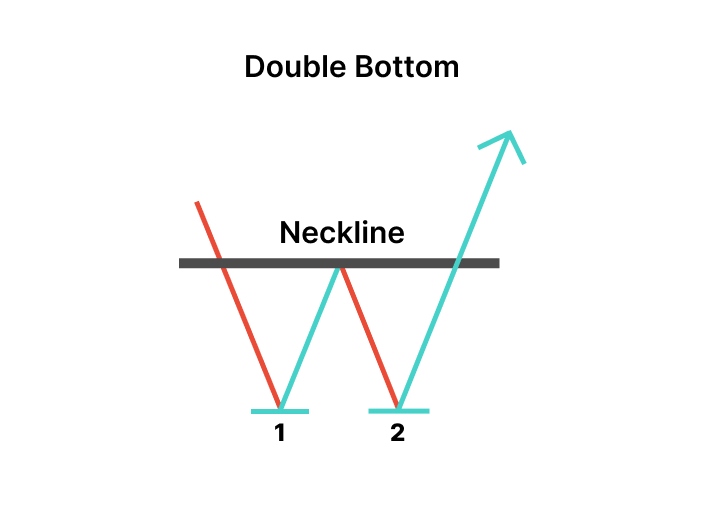
A Double Top and Double Bottom are common chart patterns in technical analysis used to identify potential trend reversal points in financial markets:
Double Top:
A Double Top pattern occurs after an uptrend and consists of two peaks that reach a similar price level with a trough in between.
The pattern indicates a weakening in upward momentum and can serve as a bearish reversal signal.
Traders use the confirmation of a breakdown below the trough (support level or neckline) as a potential signal to enter short (sell) positions. A common practice can also include placing a stop-loss just above the peak of the double top.
The distance from the peak to the trough can be used to estimate a potential price target for the downward move.

Double Bottom:
A Double Bottom pattern forms after a downtrend and comprises two troughs that reach a similar price level with a peak in between.
The pattern signals a potential reversal of the downtrend and can be considered a bullish reversal pattern.
Traders often enter long (buy) positions after the price breaks above the peak (resistance level or neckline). Traders may also add a stop-loss just below the trough of the double bottom.
The distance from the trough to the peak can be used to estimate a potential price target for the upward move.
Traders typically use these patterns in conjunction with other technical and fundamental analysis tools to confirm potential trend reversals and make well-informed trading decisions.
