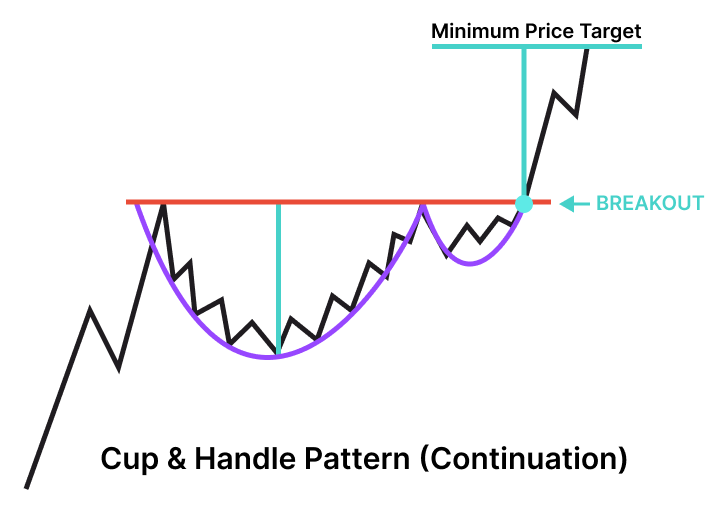
The Cup and Handle pattern is a bullish chart pattern used in technical analysis to identify potential trend reversals and continuation of an existing uptrend in financial markets. This pattern typically consists of two parts:
Cup: The initial part forms a rounded, U-shaped bottom, resembling a cup. It represents a period of consolidation and price decline, often after a prolonged downtrend or correction.
Handle: Following the cup formation, there is a smaller consolidation or correction phase, forming a handle that slopes downward. This part usually has lower trading volumes than the cup.
Traders use the Cup and Handle pattern as follows:
Bullish Signal: The breakout from the handle's upper boundary signals a potential bullish reversal or continuation of the previous uptrend.
Entry Point: Traders typically enter long positions (buy) when the price breaks above the handle's resistance.
Stop-Loss and Price Target: Stop-loss orders are often set just below the handle's support, and the pattern's height is used to estimate a price target for the upward move.
The Cup and Handle pattern is considered a reliable chart pattern, but it should be used in conjunction with other technical and fundamental analysis tools to confirm trading decisions.
