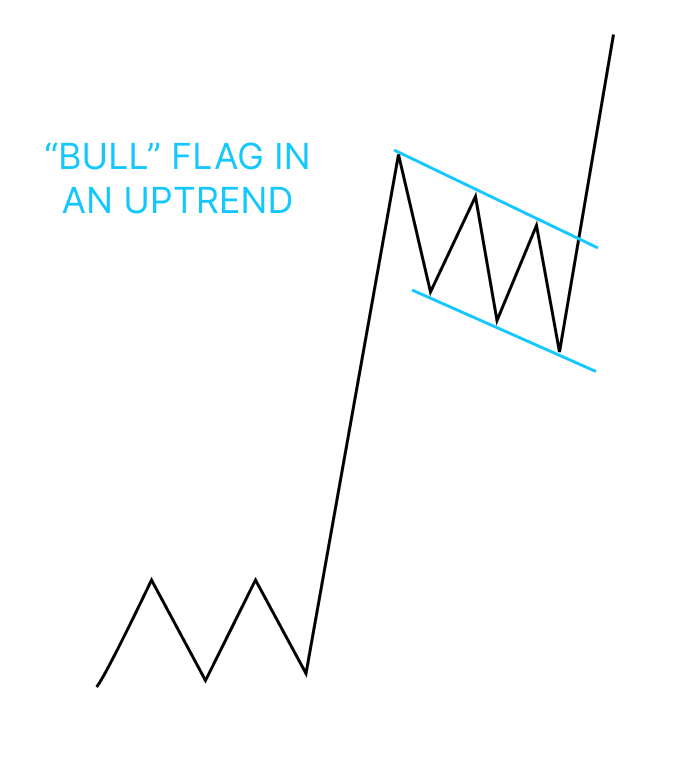
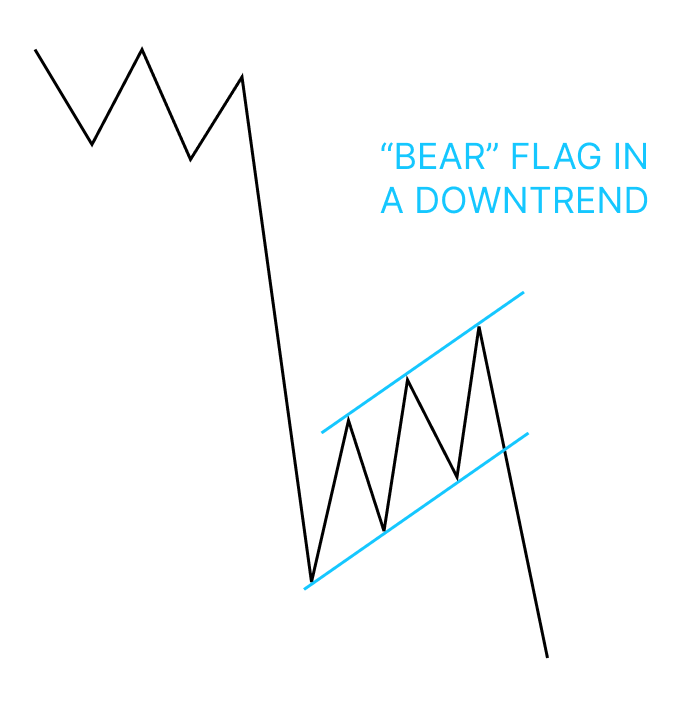
Bull and Bear flags are two of the most commonly used chart patterns in technical analysis. Technical analysis is a method used in financial markets to forecast price movements by analyzing historical price and trading volume data. It involves studying chart patterns, trends, and indicators to identify potential buying or selling opportunities. Practitioners of technical analysis believe that historical price patterns repeat and can provide insights into future market behavior. However, its effectiveness is debated, and it's often used in combination with other forms of analysis to inform trading decisions.
Bull Flag and Bear Flag are two common chart patterns used in technical analysis to predict potential price movements in financial markets, especially in trading stocks, forex, and other securities. They are typically observed on price charts and are characterized by their distinct shapes and patterns.

The breakout from a bull flag is usually in the direction of the prevailing trend, which means that once the price breaks above the upper boundary of the flag, it's expected to resume its upward movement.

The breakout from a bear flag is generally in the direction of the prevailing trend, which means that once the price breaks below the lower boundary of the flag, it's expected to continue its downward movement.
Both bull and bear flags are considered reliable patterns when they occur in the context of a strong trend. However, like all technical patterns, they are not foolproof and should be used in conjunction with other forms of analysis and risk management techniques.
It's important to note that these patterns are just tools used by traders and analysts to make educated guesses about potential price movements. They should be used in conjunction with other forms of analysis, such as fundamental analysis, and should not be the sole basis for making trading decisions.