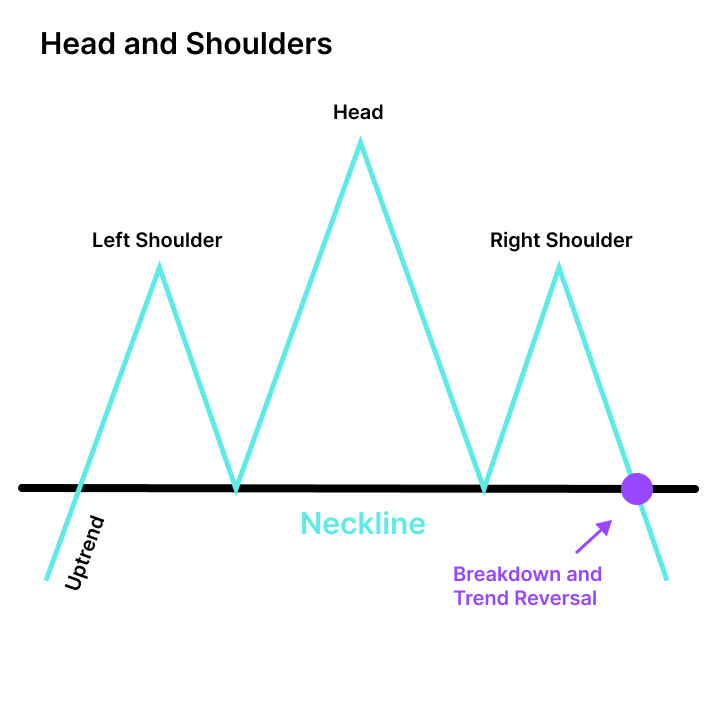
The Head and Shoulders pattern is a significant technical chart pattern in financial markets, primarily used to predict trend reversals. It is characterized by three distinctive peaks and troughs that resemble a human head and shoulders, typically seen after a prolonged uptrend and signaling a potential shift to a downtrend. The pattern consists of the following components:
Left Shoulder: The first peak forms during an uptrend, indicating a high point in the price.
Head: The central peak is the highest in the pattern and forms after the left shoulder, often reflecting a climax or strong resistance level.
Right Shoulder: The third peak, similar in height to the left shoulder, occurs after the head and typically signals weakening upward momentum.
Traders may use the Head and Shoulders pattern as follows:
Reversal Signal: When the pattern is complete, with the neckline connecting the lows of the left and right shoulders, a break below the neckline is considered a bearish reversal signal, suggesting that the price is likely to decline.
Entry and Stop-Loss: Traders typically enter short positions (sell) after the neckline break and set stop-loss orders just above the pattern's right shoulder.
Price Target: The projected price target for the Head and Shoulders pattern is estimated by measuring the vertical distance from the head to the neckline and subtracting it from the neckline's breakout point.
It's essential to use the Head and Shoulders pattern in conjunction with other technical and fundamental analysis tools to confirm potential trend reversals and make well-informed trading decisions.
