Ascending and Descending Triangles are common chart patterns used in technical analysis to predict potential price movements in financial markets.
1. Ascending Triangle:
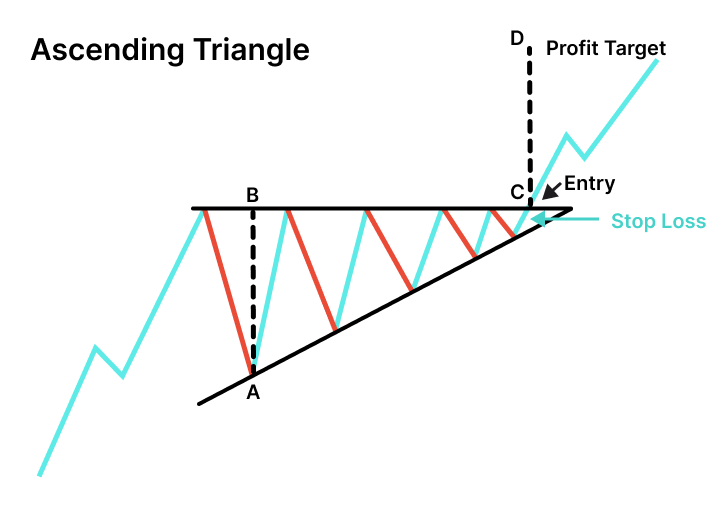
An ascending triangle is a bullish continuation pattern formed during an uptrend.
It consists of a horizontal resistance line (upper trendline) and an ascending support line (lower trendline).
Traders look for the price to repeatedly touch the resistance level while the support line slopes upward.
The breakout typically occurs to the upside, indicating a potential upward continuation of the existing trend.
Traders can enter long (buy) positions when the price breaks above the resistance line, setting stop-loss orders below the support line.

The height of the triangle can be used to estimate a price target for the upward move.
2. Descending Triangle:
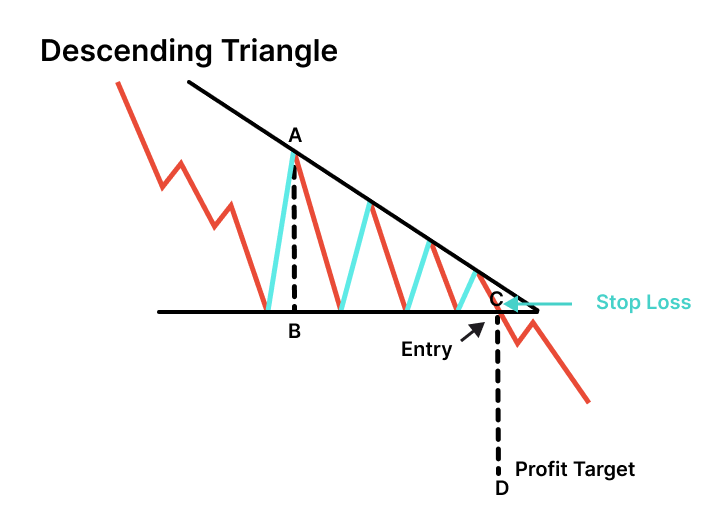
A descending triangle is a bearish continuation pattern formed during a downtrend.
It is characterized by a horizontal support line (lower trendline) and a descending resistance line (upper trendline).
Traders observe the price repeatedly touching the support level while the resistance line slopes downward.
The breakdown typically occurs to the downside, suggesting a potential continuation of the existing downtrend.
Traders can enter short (sell) positions when the price breaks below the support line, with stop-loss orders above the resistance line.
The triangle's height can be used to estimate a price target for the downward move.

Both patterns can be useful for identifying potential entry and exit points and for setting stop-loss and take-profit levels. However, as with any technical pattern, it's important to consider other factors and use additional analysis to make well-informed trading decisions.